Applications
An application is one deployable thing — a compose file and the history of every version of it you have pushed. It belongs to an organization, and it is where you spend most of your time in the control panel.
There are three levels, and you move between them with the breadcrumb trail at the top of every page:
| Level | Answers |
|---|---|
Applications (/applications) |
which applications can I see, and what is live on each? |
One application (/applications/{id}) |
what is live here, what does it cost, what else have I deployed? |
One revision (/applications/{id}/deployments/{id}) |
what is this version — built from what, running what, costing what? |
Finding your way around
Every page below Applications carries a breadcrumb trail: each level you came through is a link, and the page you are on is the last entry and is not.

Click any earlier crumb to step back a level. The trail is the same on the variables page, the logs page and the new-deployment form, so you are never more than one click from the application you were looking at.
The application list
The Applications link in the sidebar lists every application in every organization you belong to, with what is currently deployed on each.
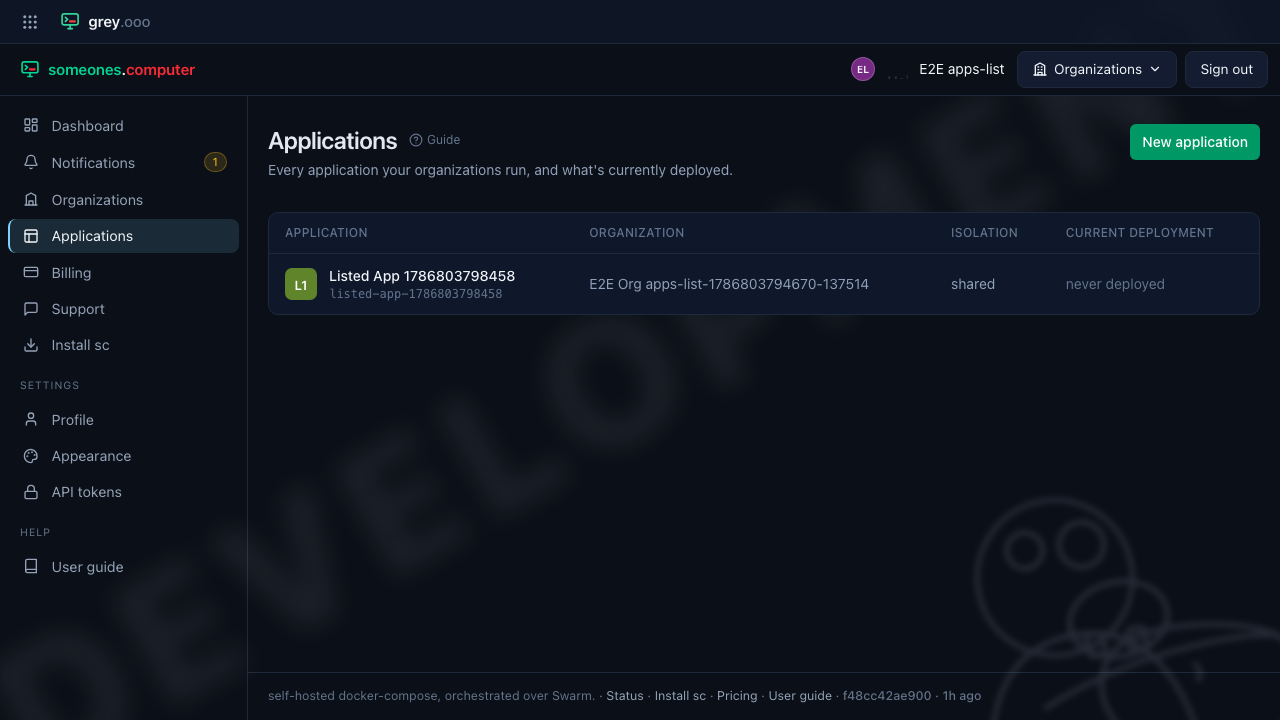
Click an application's name to open its dashboard.
Icons
Every application has an icon, shown here, on its dashboard and in its organization's application table. Until one is stored for it, the icon is drawn from the application's name and colour-keyed to its slug — so it is stable, and it never changes when you rename the application.
Deploy something that serves a favicon and it becomes the icon by itself. Each
time a revision goes live the platform fetches the application over its own
hostname, reads the icons the page declares (including a web-app manifest's, and
/favicon.ico), and adopts the best one. Nothing to configure, and nothing breaks
if there is no favicon — the drawn icon stays.
An operator can store an icon by hand with
php bin/console app:application:icon <slug> <file>. An icon set that way is kept:
later deploys will not replace it. --clear goes back to the drawn one, and
--from-favicon re-checks the deployed application immediately instead of waiting
for the next deploy.
An application's dashboard
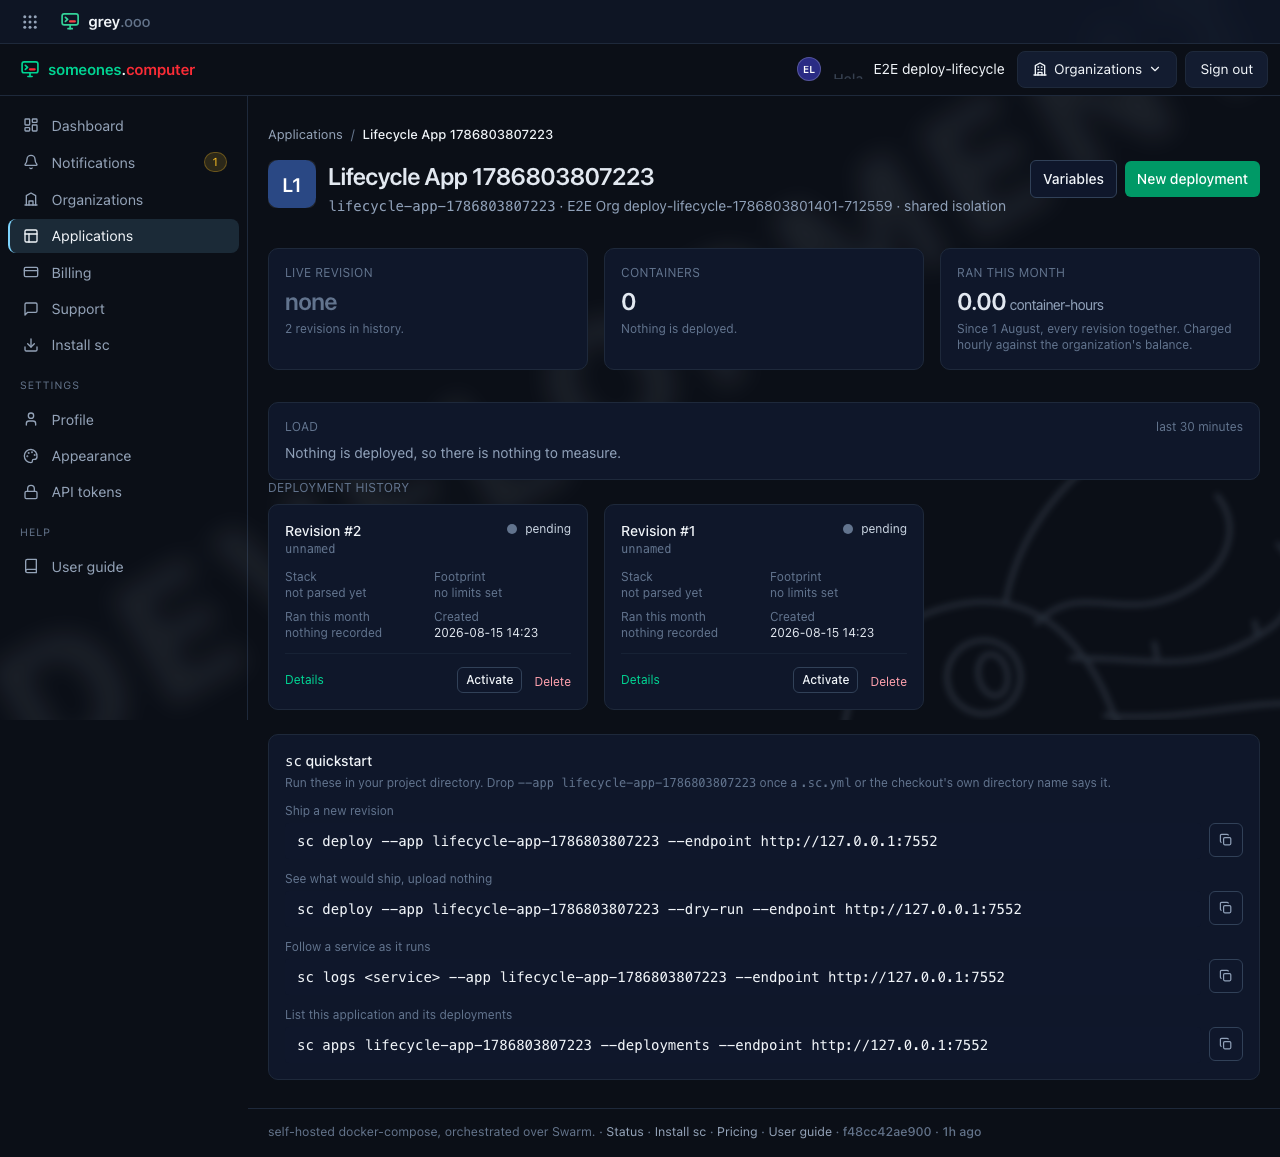
Three figures at the top say what the application is right now:
- Live revision — which revision the application is serving, and what state it is in. Click the number to open that revision. "None" means nothing is deployed, which is not an error — a newly created application has no revisions and answers on no address until you deploy one.
- Containers — replicas summed across the live revision's services. This is the figure billing counts.
- Ran this month — container-hours across every revision since the 1st.
This is what the organization is charged for, an hour at a time — see
Billing. The rates themselves are still
placeholders (
/pricingsays so on the page), but the meter behind them is real and the figure here is the one the charge is computed from.
Below those, two panels appear only when they have something to say:
- Not running what was asked for — the swarm is reporting fewer containers than the revision asked for. A deploy still rolling out reads short for a few seconds; anything longer is worth a look.
- Addresses — where the application answers, including any of your own domains pointed at it.
Network
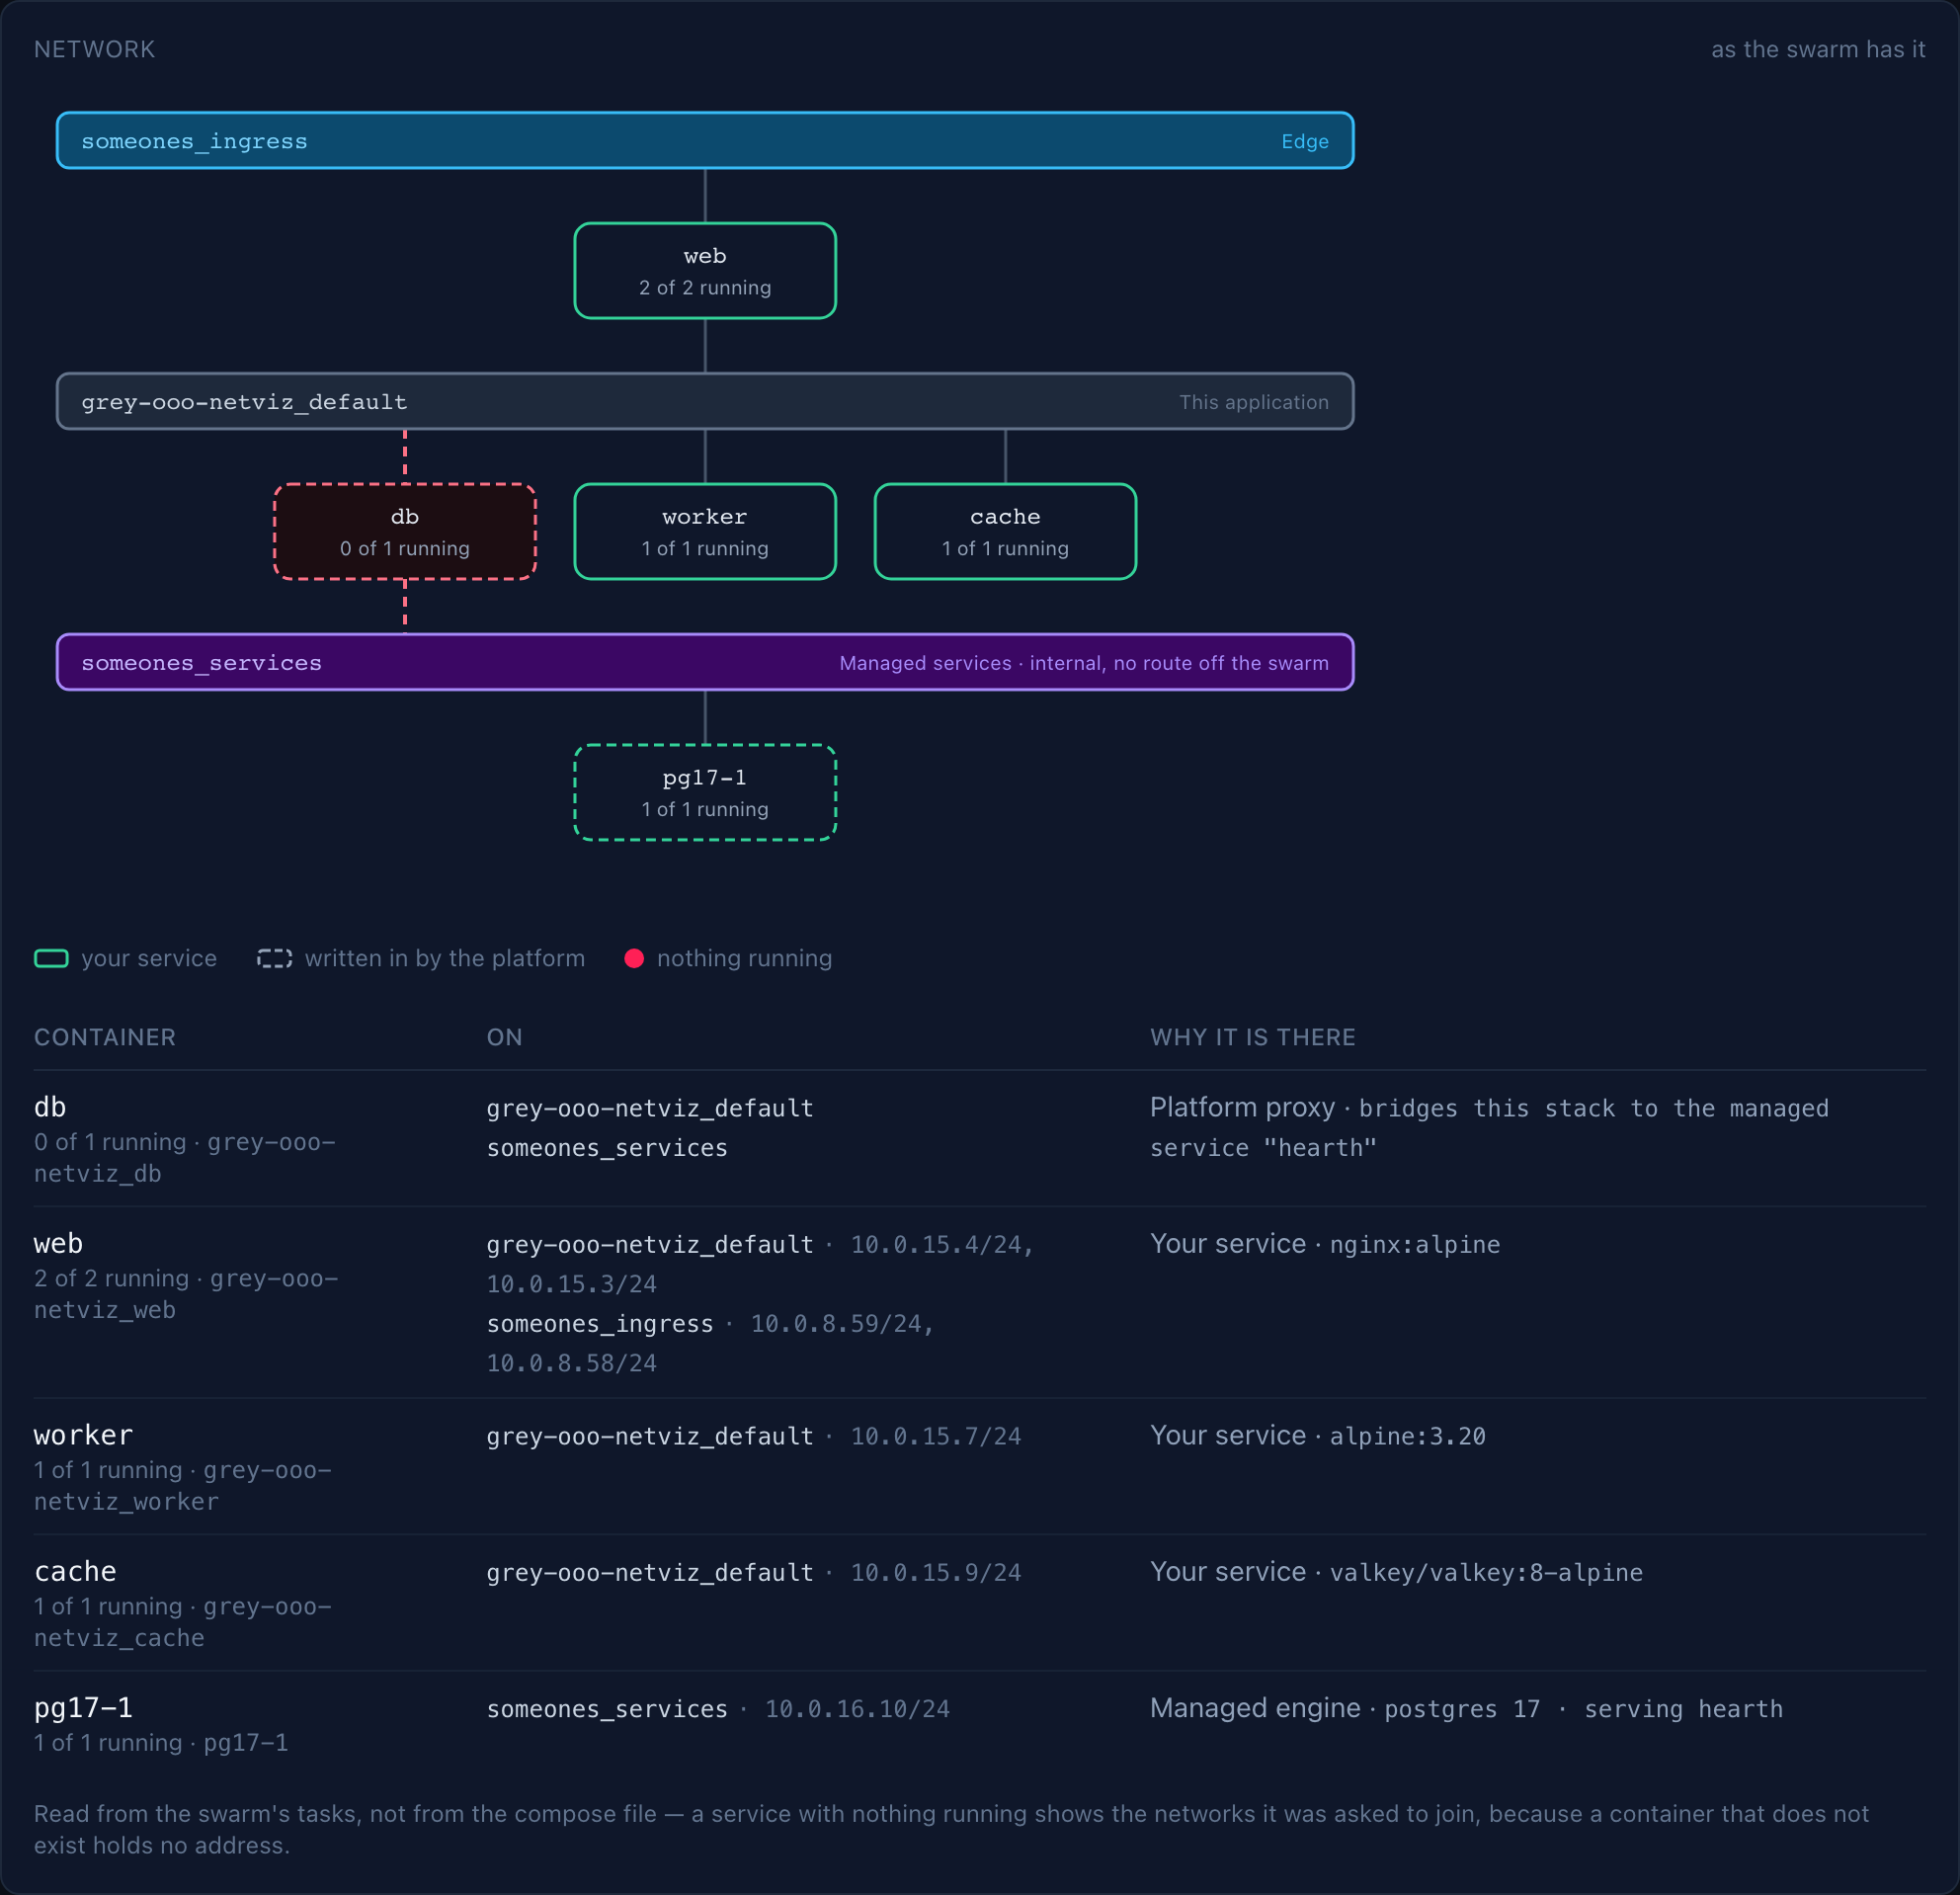
What the application is plugged into, read off the swarm rather than worked out from your compose file — so it shows what is actually attached, not what was asked for.
Networks are drawn as bars and containers as boxes on them, ordered the way a request travels:
| Bar | What being on it means |
|---|---|
Edge (someones_ingress) |
Reachable from the internet through the edge. Only services that speak HTTP join it |
This application (<stack>_default) |
Your revision's own overlay. Services resolve each other by their compose name, and nothing outside the stack can reach them |
Managed services (someones_services) |
Internal — no gateway, no route off the swarm. Only the platform's own proxies and engines attach |
A box straddling two bars is what bridges them. A public service sits between the
edge and your overlay; the db proxy a managed-service binding adds sits between
your overlay and the engine's, which is the only way into a managed database —
your own containers are never on that network.
A dashed outline means the platform wrote that container into your stack rather than your compose file doing it: the binding proxy, and the engine behind it. A red one means nothing is running.
The table underneath carries the two things a picture cannot: the swarm's own
name for each service, which is what docker service ps wants, and the overlay
address it answers on.
The panel loads when you scroll to it, because it asks the swarm live each time. A service with nothing running shows the networks it was asked to join — a container that does not exist holds no address.
Deployment history
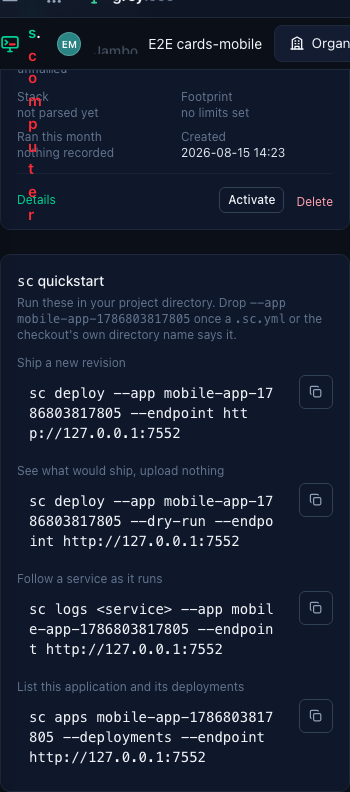
Every revision is a card. Cards are the unit of comparison: the same four figures on each, so you can see at a glance which revision doubled its replicas or which one has been quietly running all month.
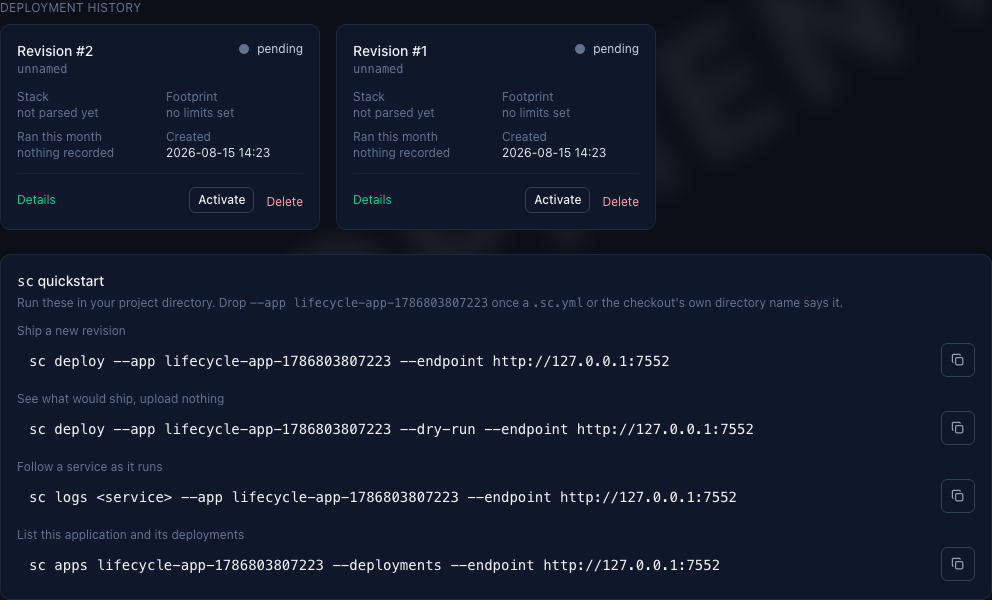
| On the card | Means |
|---|---|
| Stack | services × replicas in this revision. "Not parsed yet" means the build worker has not seen it. |
| Footprint | CPU and memory limits declared in the compose. "No limits set" is common and fine — the swarm then decides. |
| Ran this month | container-hours attributed to this revision. See what "attributed" means. |
| Created | when the revision was recorded, not when it went live. |
A failed revision shows why on the card rather than making you open the build log to find out.
Details opens the revision's own dashboard. Where the revision is the live one and running, each service also links to its live log. Owners and admins get Activate / Stop and Delete here; rolling back is the same gesture as rolling forward — pick the revision you want and activate it.
The list updates itself: a build starting, finishing or failing moves a card without you reloading. See live updates.
On a narrow screen the cards stack rather than scrolling sideways:
A revision's dashboard
The application page answers "which revision is live?". A revision's own page answers "what is this revision?" — the things that used to require reading the raw compose or a build log.
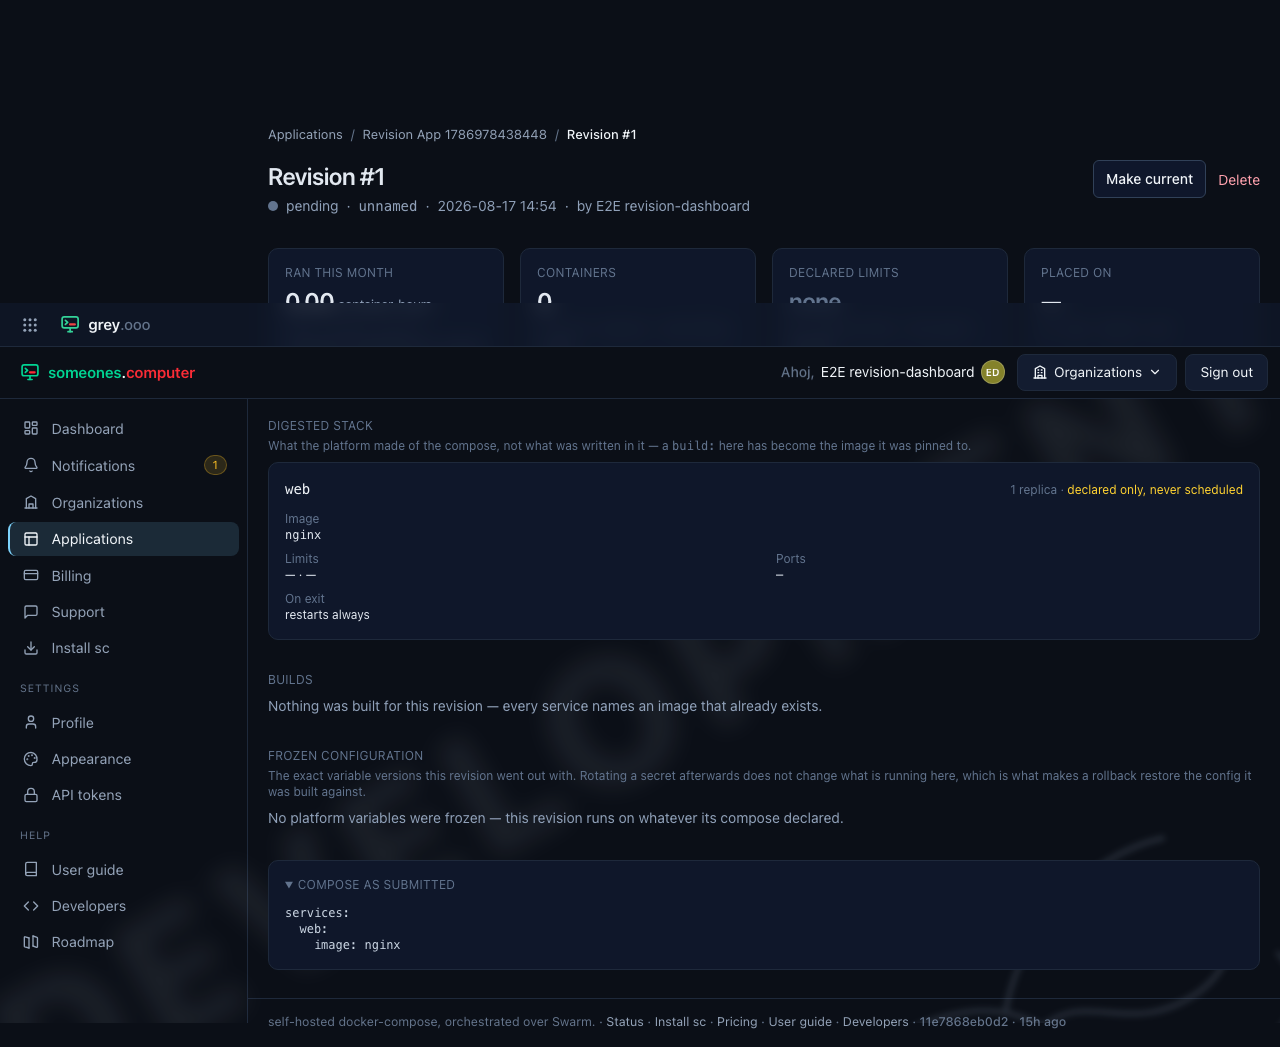
Header — the sequence number, its name (sc defaults this to your branch,
so the normal shape is a revision per branch), its state, when it was recorded
and by whom. A revision that failed carries the reason in full underneath, not
truncated:
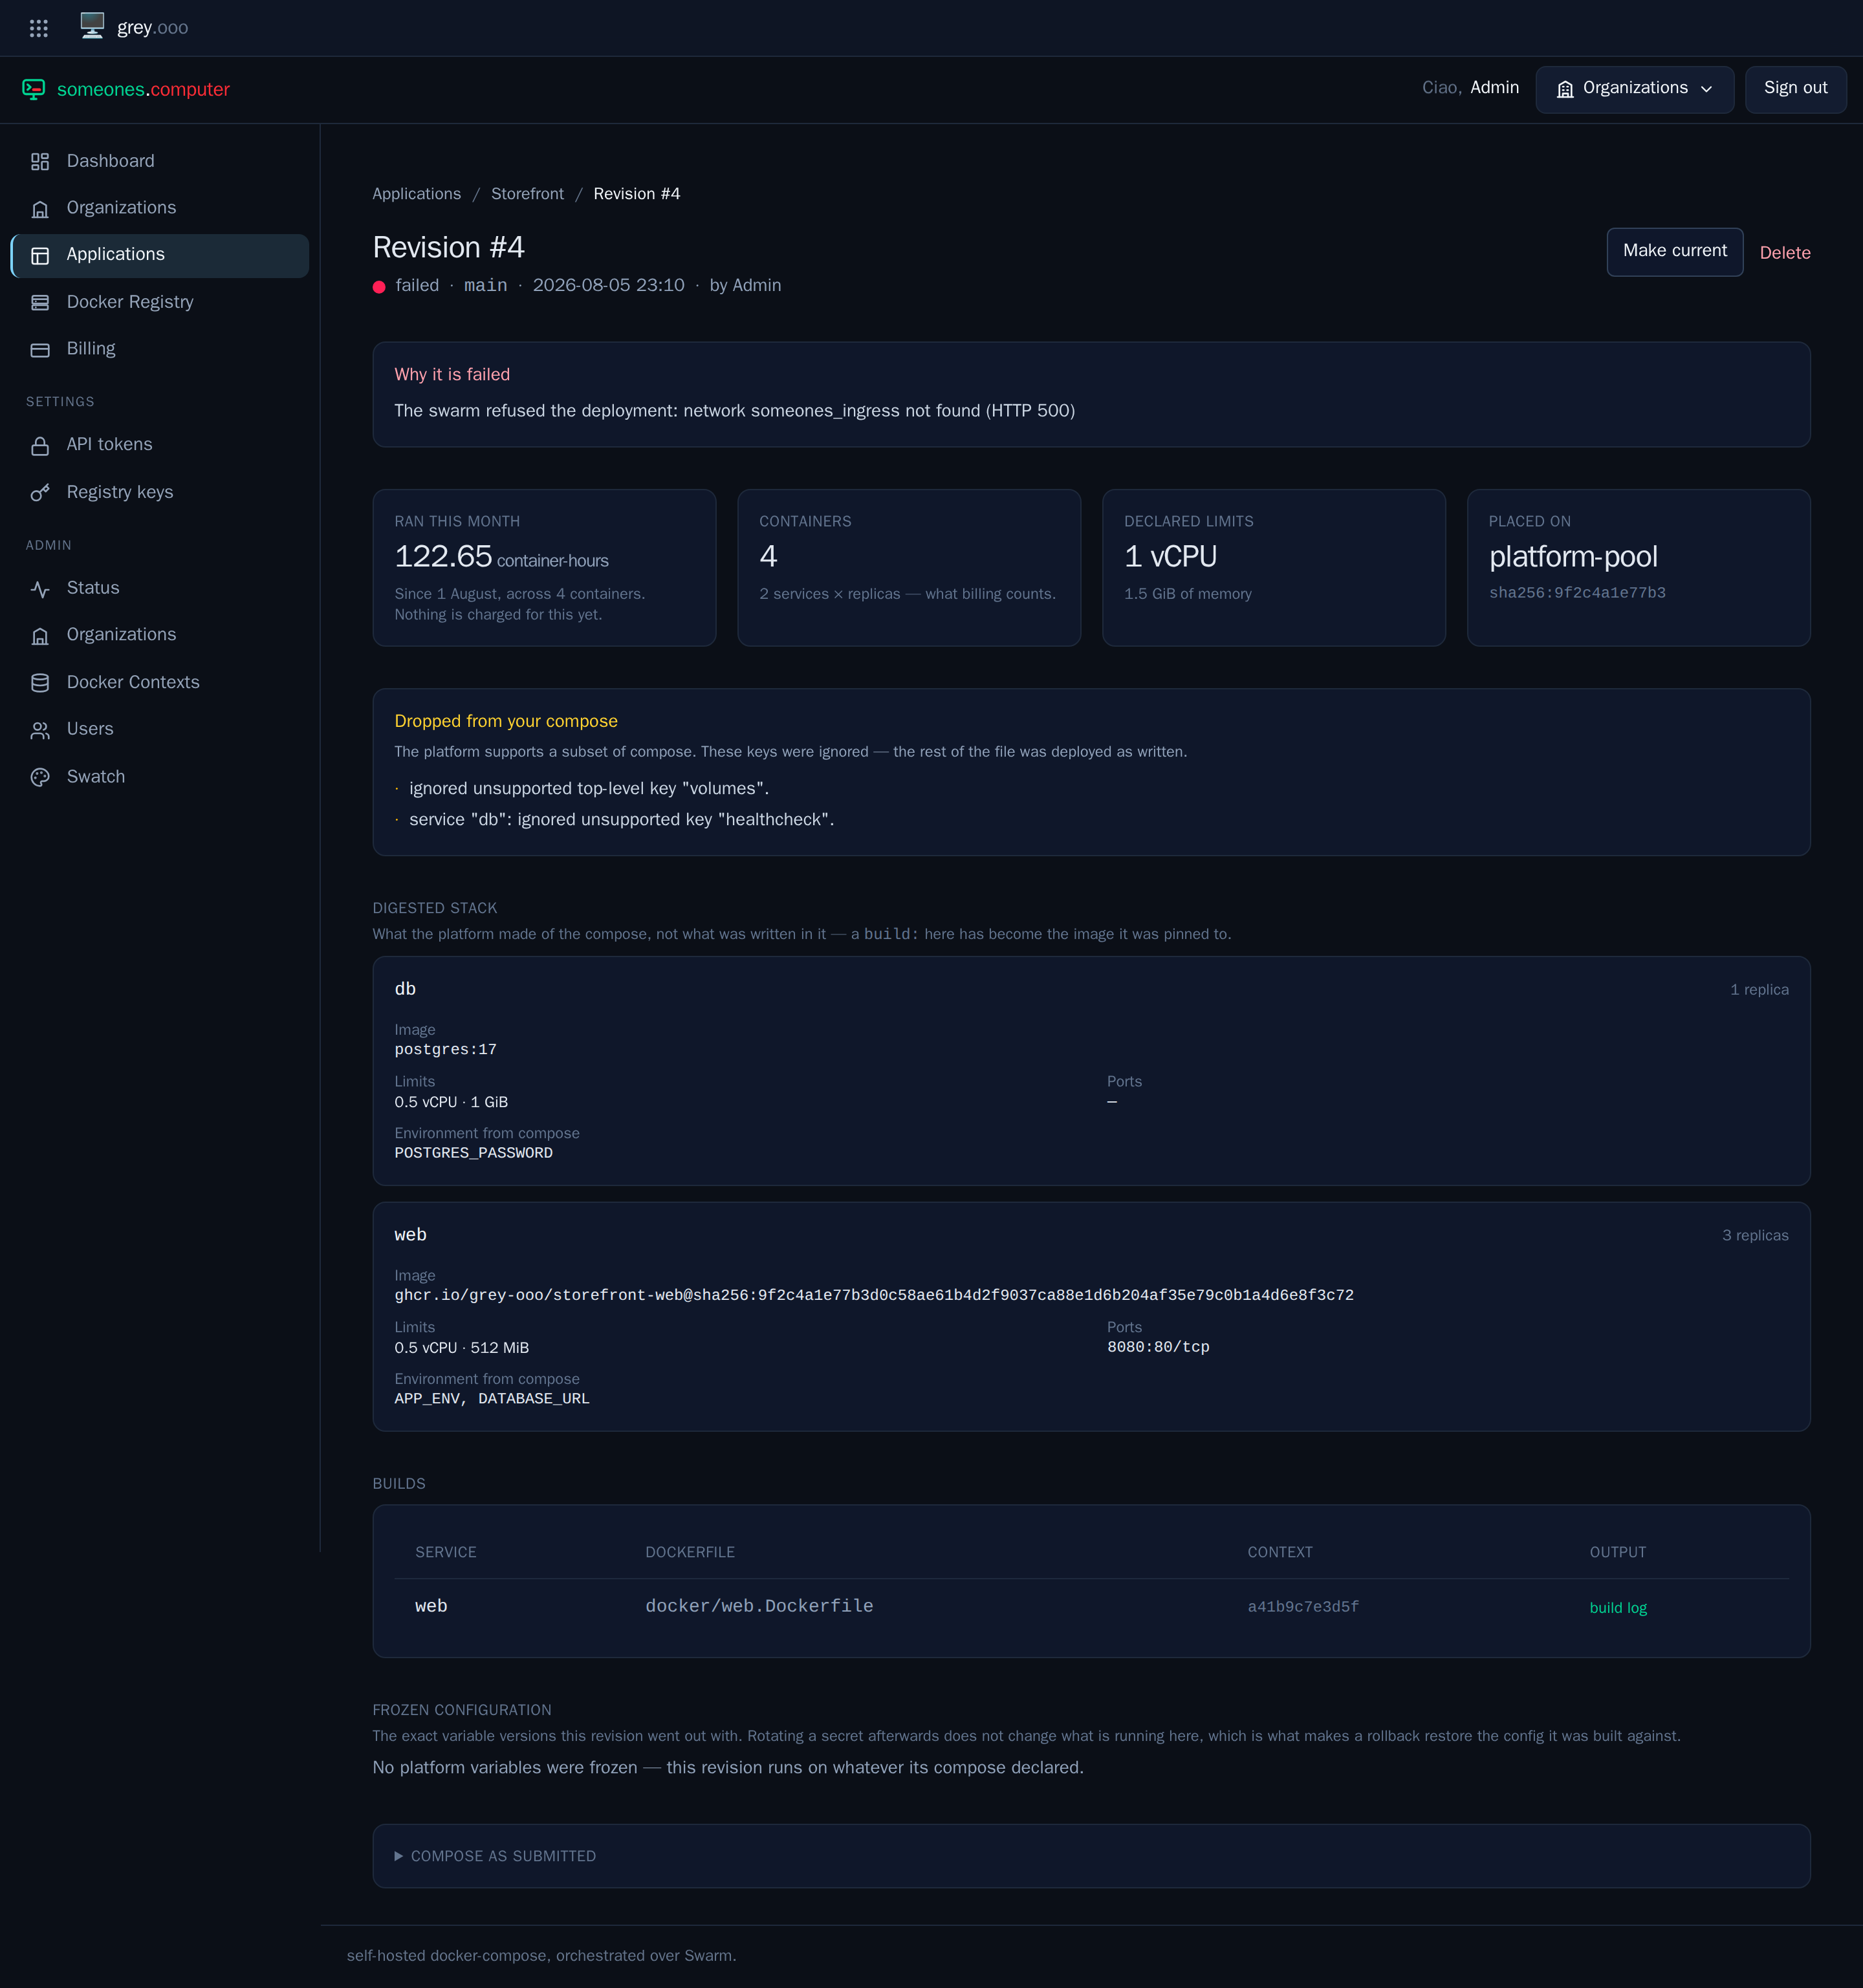
Four figures — what it ran this month, its container count, its declared limits, and which Docker context it was placed on together with the digest of its spec.
Dropped from your compose — the platform supports a subset of compose, and
anything outside that subset is stripped with a warning rather than rejected.
This panel is those warnings. If you are wondering why a volumes: block seems
to have done nothing, this is where it says so. It is absent when nothing was
dropped.
Digested stack — what the platform made of your compose, which is not always
what you wrote. A service declared with build: shows the image it was pinned
to; limits appear in the units you wrote rather than the nanoseconds and bytes
they are stored as. Environment variables from your compose are listed by name
only — a compose file routinely has a password typed into it, and no page here
will show you a value back.
Each service also says what happens on exit. restart: no makes a service a
one-shot — a migration or a batch job, run once per replica and then finished,
rather than a container the platform keeps restarting for ever. That distinction is
the point: a job that has exited reads as done here instead of as a service that
is down.
Builds — one row per service that shipped a build context, with the Dockerfile it used, the hash of the context that was uploaded, and a link to what the builder printed. A failed build keeps its log too; that is when anyone actually wants it.
Frozen configuration — the exact variable versions this revision went out with. Rotating a secret afterwards does not change what is running here, which is what makes a rollback restore the config the revision was built against rather than the old image with the new config.
Compose as submitted — collapsed by default: exactly what was uploaded, byte for byte.
Like the list it came from, this page updates itself while you watch. Opening a revision that is mid-build and leaving it there is a reasonable way to follow a build to its end.
What "ran this month" really counts
Container-hours are derived by pairing each container's observed start with the stop that follows it, per container — three replicas running the same half hour are ninety container-minutes, not thirty.
Two honest limitations, both stated on the page rather than rounded away:
- A start with no stop means either the container is still running (billable to now, and the platform checks whether the swarm still reports it) or its stop was never observed. The second case is counted separately and the figure is labelled a floor rather than a total, because inventing an end time would be worse than admitting a gap.
- Attribution begins where the ledger does. Usage is attributed to the revision that was current when the container started, so an interval belongs to whichever revision actually ran it even if a newer one took over before it stopped. Usage recorded before the platform tracked this reads as "nothing recorded" on a revision card, though it still counts towards the application's and the organization's totals — see billing.